UTAS Research
Live Music In Australia
Although generous in discussing their motivations, commercial risks and business models, a number of the live music venue owners and operators were reluctant or unable to fully disclose their cash flows.
This reflects the commercially sensitive nature of financial data in an industry that is still largely cash-based and the often-complex commercial arrangements within each venue. Several venues, for example, could not provide an accurate account of what was paid to artists, as they allowed the bands to set and collect a door charge, or leased their space to independent promoters. Similarly, approximately half of the venues interviewed identified staff working in their venues that they didn’t pay directly. Given the issues previously identified with producer data under-representing the economic impact of live music, we therefore prioritised the consumer survey as a more reliable source of economic data for the purposes of this cost benefit analysis.
The online survey was promoted directly to consumers through several industry and peak-body mailing lists and media stories in national and local news outlets. Participants were allowed to self-define live music; although, certain prompts were given to encourage a holistic consideration of the activity. This ensured that our definition of live music was consistent with community, rather than the researcher’s, understanding of the term.
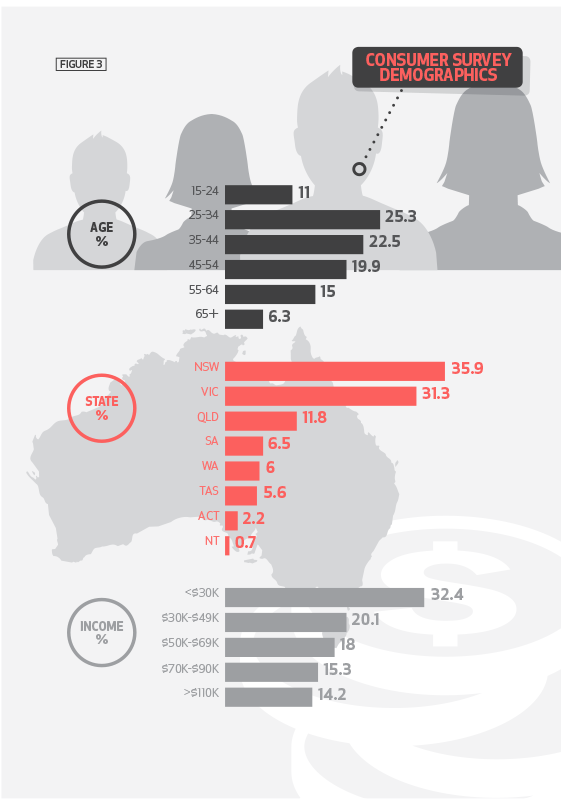
Of the survey respondents who provided demographic data, 64.2 per cent identified as male and 35.8 per cent as female. A breakdown of respondents by age, State of residence and reported income is shown in Figure 3. Respondents reported attending a range of live music, from hip hop and metal to classical and jazz, though there was a strong overall preference for popular music.
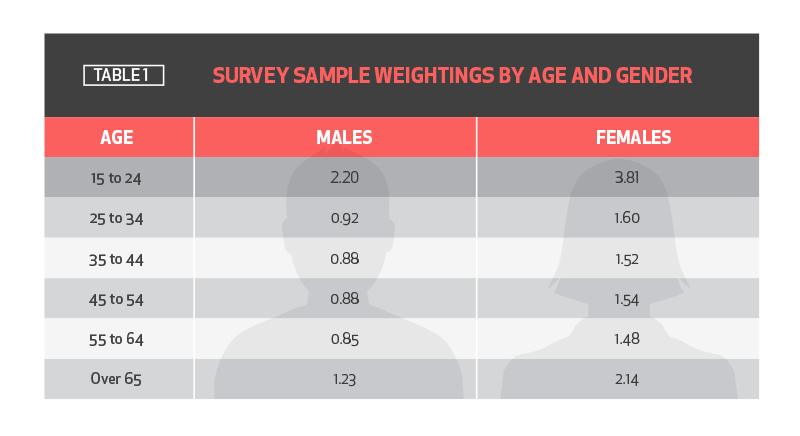
In order to normalise the sample we therefore weighted it against the most recent ABS data on “popular concert” attendance (ABS, 2010a). After applying the weights shown in Table 1, sample age and gender were not significantly different from the population distributions of popular music patrons (p>0.05 for both).
This weighting does not account, however, for other potential biases introduced by our sampling method. For example, a disproportionate number of respondents were highly engaged by live music, and performing musicians and industry workers were potentially over-represented. This is probably explained by our use of industry mailing lists to promote the survey and the self-selecting nature of respondents. Therefore although this outcome was anticipated and unavoidable due to the resource limitations of this study, it is not possible to draw conclusions about the population-wide volume of live music attendance from this data set.
Disregarding then our sample’s self-reported volume of expenditure on the basis it was highly likely to be skewed (an issue we will resolve shortly); it was nevertheless found that individuals’ patterns of spending shown in Figure 4 were not significantly affected by their level of engagement (hours per month; p>0.05). In other words, regardless of how much an individual reported spending on live music – whether it be 100 dollars or 10,000 dollars per year – there was not a statistically significant difference in their patterns of spending.
We can therefore vastly improve our understanding of the scope of individuals’ investment in their live music interest by commencing to build a satellite account.