Projects
Several attempts have been made to place a dollar value on Australian and international live music industries. These studies typically focus on statements of economic impact, such as the increases in spending and employment associated with participation and patronage (CNV, 2014; Deloitte Access Economics, 2011; Ernst & Young, 2011, 2014; Meyhoff, Krohn, & Sjøvold, 2014; Newton, 2012; Page, 2010; Portnoff, Nielsén, & Sternö, 2013; Pricewaterhouse Coopers, 2014; Rogers, 2013; SGS Economics, 2011; Spahr, 2013; Worden, 2010).
The headline figures reported by many of these studies describe the volume of live music transactions such as ticket sales and, in some cases, related consumer spending on food and beverages. The figures for each country in Figure 1 show transaction volume figures for Australia and other live music markets as reported in a number of recent studies.
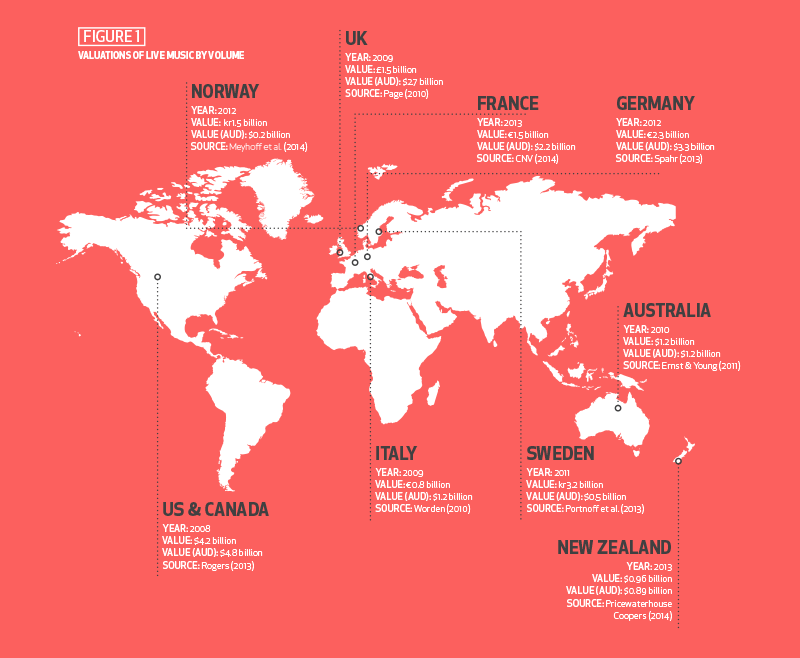
Problematically, such valuations inevitably overstate the fiscal benefits of the sector by failing to account for the substitutability of profit. For example, when an internationally touring artist who brings their own production visits a region, the volume of ticket transactions is a poor proxy for community benefit, when the vast majority of profits are enjoyed off-shore.
The more robust of these analyses apply the widely accepted economic input / output method to estimate the economic contribution of the live music making industries. For example, in Australia, the gross value added (GVA) to the economy by live music was estimated to be 652 million dollars (Ernst & Young, 2011). More recently in the United Kingdom it was estimated to be £789 million (UK Music, 2014), or AU1,466 million dollars. Related approaches to valuing live music (or, more broadly, the creative industries) include the works of (Ansell & Barnard, 2013; Bakhshi, Freeman, & Higgs, 2013; Higgs, Cunningham, & Bakhshi, 2008; Higgs, Cunningham, & Pagan, 2007; Sigurðardóttir, 2011; Williamson, Cloonan, & Frith, 2003).
All of these findings need to be treated with similar caution, as they rarely account for the fact that if consumers didn’t spend their money on live music, they would spend it on something else. Counter-methods that might mitigate this such as opportunity costing and/or equilibrium modelling are not evident in the studies cited. Consequently input / output analysis on its own is largely discredited as a basis for decision making in policy (Australian Bureau of Statistics (ABS), 2010b; Gretton, 2013).
More importantly, nearly all of the economic modelling of live music carried out to date is limited by a reliance on producer estimates of expenditure. In most industrial settings—such as in the recorded music industry where a finite number of producers operate via a limited, densely clustered number of sales channels—this is an acceptable method of data collection. Live music, on the other hand, is not a well-defined (or easy to define) industry.
By asking a sub-set of producers for the motivating data, analysts are de facto limiting the scope of their work to live music activities that fit within their own conception of what constitutes live music and/or convenience sample. For example, the French study cited in Figure 1 was limited to the pop and jazz sectors; the North America research covers only the top 200 grossing tours, excluding festival and club events; and the Australian, UK and Italian figures only reference peak body or specifically licensed or registered venues (Laing, 2012).
Many of the recent Australian studies on the economic impact of live music are affected by similar limitations. Newton (2012), for example, argues that lists of live music venues used by Ernst and Young (2011) and Deloitte Access Economics (2011) did not align with those identified in NMIT’s annual ‘State of Play’ reports; and that the modelling conducted by Ernst and Young and Deloitte likely understated the scale of live music activity. This was attributed primarily to differences in sampling methods, which may have been compounded by the 2011 reports relying on static venue lists generated from the Australian Performing Rights Association’s (APRA AMCOS) dynamic database. To address his concerns over sampling accuracy, Newton and 100 volunteers undertook a census of Melbourne venues that, combined with data from Live Performance Australia, produced a much more accurate estimate of the scope of live music activity in the city. A key limitation of Newton’s research however is that it is only descriptive of volume and does not attempt to value the economic impact.
Another significant issue is one of scope, in that the sum of live music consumption in the economy is invariably under-reported, not reported or not available to producers. Licensed venues and ticketing agencies are often the only source of data available to economists working in this space, and these have been shown to provide an incomplete picture of live music motivated transactions (Newton, 2012). Additionally producers are unlikely to be able to reliably account for the secondary markets that exist within their venues, such as ticket scalping and merchandise sales.