Projects
When the physical artefacts of live music making are exploited by human endeavour, a significant suite of commercial benefits accrue. Our analysis reveals the change in final demand of 5.0 billion dollars brought about by the live music expenditure of consumers (Direct Costs) increases output in the Australian economy by 9.7 billion dollars. This enables 1.2 billion dollars in profits for producers across a wide range of industries.
The efficiency with which this process occurs is known as productivity. The financial return that live music dependent enterprises receive on their investments of capital, labour, energy, materials and services is therefore estimated to be 12.7 per cent.
Of more interest is a relatively under-explored and un-quantified benefit: the productivity benefits consumers of live music receive, enabling them to be more effective and efficient in their chosen employment. In this report, it is conservatively estimated that consumers enjoyed 884.3 million dollars in net productivity benefits as a result of their engagement with and consumption of live music. Although accrued by individuals, this benefit was actually realised by their employers, and as such is represented here as a commercial benefit.
Therefore, the sum of benefits returned to businesses as a result of live music making in Australia in 2014 was estimated to be 2.1 billion dollars.
Input / output modelling
The value of expenditure associated with live music making in Australia can be understood in two contexts. Firstly, the amounts spent by individuals, businesses or government on live music making in Australia reveal a value that the community perceives in the activity. Secondly, expenditure on live music making creates a change in final demand that has an economic impact on employment, output and gross national product. The economic impact includes the impact on intermediate goods and the compensation of employees.
Analysis of the total impact, including indirect effects, is based on an understanding that industries, and individual companies within these industries, do not exist in a vacuum, but use each other’s products to produce their own. Thus, an increase in demand for one industry’s products leads to increases in the demand of other ‘linked’ industries.
An input / output (I/O) representation of the economy is comprised of a set of industries which are linked by these I/O or intermediate relationships and by the final demand for each industry’s output. The model used in this report is the Australian Regional Input-Output Matrix (RIOM) model.
Broadly speaking, I/O modelling examines how different industries interact to produce final demand. For example, a grain farmer (as part of the Agriculture industry) may sell some of his or her grain to a brewer (part of the Manufacturing industry), who uses it as an ingredient in his or her beer. This company in turn sells some of its output to a liquor wholesaler (part of the Wholesale Trade industry), who sells some of it to a live music festival, who passes it on to a patron.
The same 50 grams of grain has been sold several times, but only the last transaction represents final demand. Thus, the inputs required by one industry form part of the demand for the products of another.
There are two major types of I/O models: open and closed models. In open models, the labour and wages of employees and the gross operating surplus of companies are treated as primary inputs in the production of goods and services. Therefore, if you want to produce more widgets, you must employ more widget makers. This type of model captures the direct and indirect effects of changes in demand in one industry on the other industries in the economy.
By contrast, RIOM is a closed model that includes the household sector as a separate industry. This enables the consideration of induced effects of changes in demand. Induced impacts reflect the changes in consumer spending resulting from changes in economic activity and therefore in employment. The household sector is considered as an ‘industry’ whose outputs are labour, and whose inputs consist of consumer spending—if you create more employment, you also create an increase in demand from the household sector for consumer goods like food, accommodation, entertainment and so on.
RIOM applies the ABS Australian 2008-09 transaction tables (ABS, 2012) in conjunction with demand and employment information for each Australian State and Territory to model the impact of changes in demand on these regional economies, estimating changes in their output, employment and gross state product.
The transaction tables used in the model identify 57 industries across 17 industry sectors. For expenditure allocated to each industry sector, a unique multiplier impact is calculated estimating the impact on gross supply, output, gross state product (following the value-added method), employment, wages, imports and taxation. The Leontief multiplier is given here as:
(1-X–C)-1E – ΔO
LME = vector of live music expenditure
ΔO = change in total output
X = transaction table of intermediate demand
C = table of induced consumption demand
As previously noted, the producers and consumers of live music making in Australia spent at least 5.0 billion dollars in 2014. This figure represents final demand in five main industry categories:
- Accommodation and Food Services
- Communication services
- Creative and performing arts
- Retail Trade, and
- Road transport.
The expenditure on live music making in Australia has an economic impact that includes a combination of increased output by industries directly subject to increased live music related demand, increased output by suppliers to those industries and their suppliers, as well as increased output by all industries that have a role in supplying the demand of increased expenditure by households generated by increased wages.
Changes in employment and gross state product (GSP) are proportional to changes in output following the constant return to scale assumption inherent in I/O models. A number of the assumptions that underpin the analysis are disclosed here:
- The motivating expenditure for the analysis is the estimated expenditure in 2014. Unless explicitly stated and adjusted for, all data is sourced from that period.
- Financial multipliers are calculated using the Australian Regional Input-Output Matrix (RIOM) model. This model is derived from the 2008-09 Australian Input-Output Table adjusted for each State and Territory’s demand and employment data. Financial multipliers are assumed to be consistent between 2014 and 2008-09.
- Employment impacts are estimated using RIOM, with expenditure adjusted for CPI movement between 2008-09 and 2014.
- Live music activities were fully-realised within Australia in 2014.
- Impacts are calculated based on direct, indirect (intermediate inputs) and household consumption effects. Increases in gross operating surplus or taxation revenue are not assumed to directly result in increased expenditure in the Australian economy (the government sector is not closed).
- Where demand results in importation of goods or services from outside of Australia (interstate or overseas) no further impact is assumed on the economy.
An in-depth explanation of the RIOM modelling method can be found at Appendix 3.
The estimated economic impact of direct live music making in Australia related and motivated expenditure is shown in Table 4a. The total expenditures used to motivate the analysis are shown in column A and sum to just under 5.0 billion dollars.
In RIOM each type of expenditure is allocated to a specific industry sector for the determination of economic impact. It is estimated that the impact of this expenditure is to increase output in the Australian economy by 9.7 million dollars (column B). This includes the production of intermediate goods as well as imports of 1.9 billion dollars.
The Gross Value Added (GVA) to the Australian economy is therefore 4.4 billion dollars, or 1.1 % of Australia’s Gross Domestic Product (GDP) of 396.8 billion dollars (ABS, 2014a). This figure is broadly consistent with similar research in Iceland, valuing the contributions that live music making to GDP at approximately 1.2 per cent (Einarsson, 2005). In the UK, official government estimates place the GVA of the creative industries (of which music is a part) at 5.2 per cent of GDP (Department of Culture, Media and Sport, 2014).
Table 4a: The economic impact of live music making in Australia, 2014 ($million) Part 1
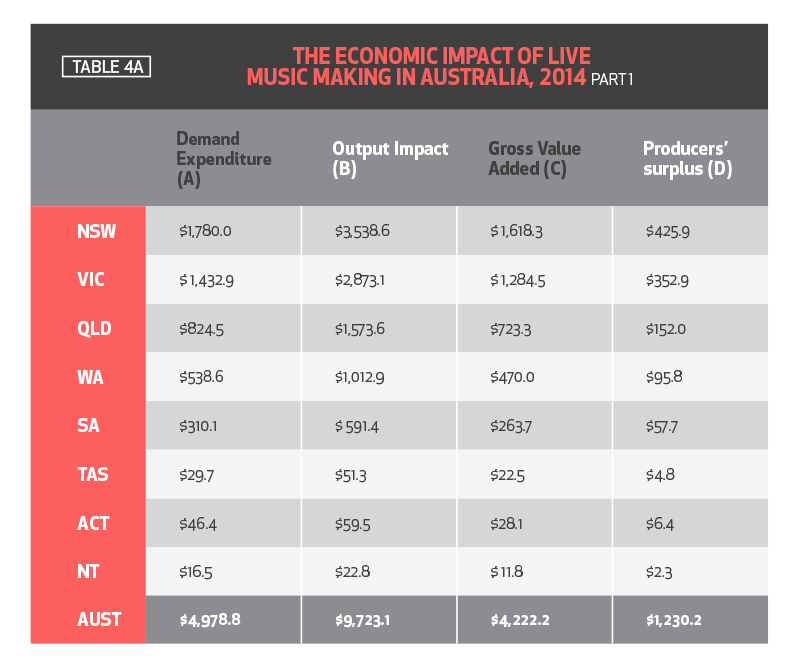
Australian firms also enjoy a net commercial benefit that is attributable to live music making. Known as the producers’ surplus, this is an economic measure of the difference between the amount that a producer of a good receives and the minimum amount that he or she would be willing to accept for the good. The difference, or surplus amount, is the benefit that the producer receives for selling the good in the market. An alternative, if theoretically imperfect, description of this is net profit.
As material inputs are already allowed for, and the assumption is that the infrastructure would exist regardless of live music making, if GVA is discounted by the cost of labour and taxes (Table 4b Columns G and H) we are left with a theoretical surplus to firms of 1.2 billion dollars (Table 4a, Column D).
In equilibrium, this surplus represents the fair return to providers of capital sufficient to cover the cost of investment and the opportunity cost of the use of land or buildings for other purposes. It should be noted that this is fundamentally a short-run concept in competitive markets. In the long-run, economic profits (profits in excess of the cost of capital) would generate new entrants that reduce profitability to normal.
Note that the nature of the modelling means that this 1.2 billion dollars is distributed amongst all Australian firms who contribute intermediate or final goods and/or services that are consumed as a result of live music making in Australia, and not just live music producers.