Projects
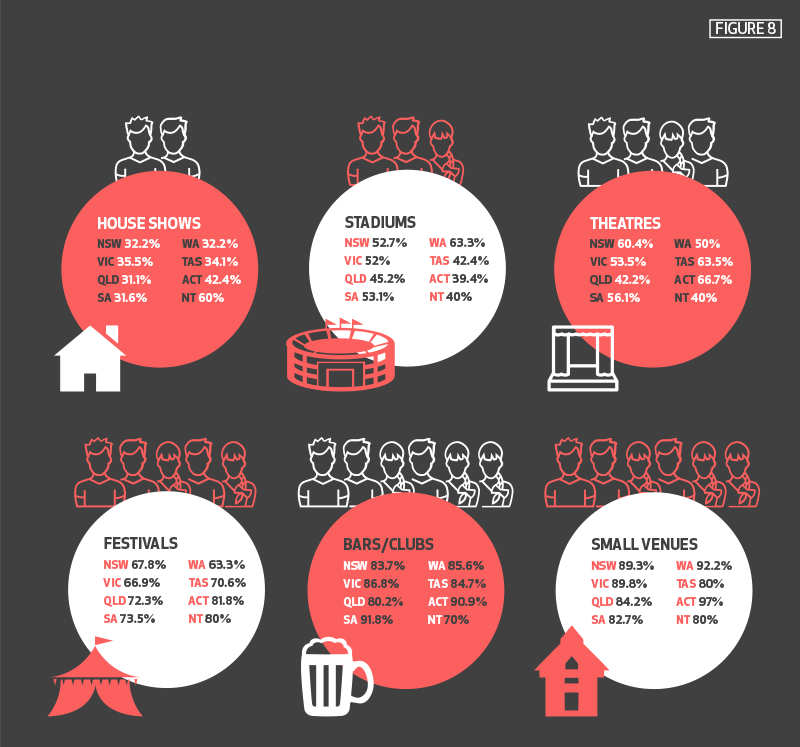
The consumers we surveyed attended music across a range of venues from house shows to stadium concerts and festivals. Figure 8 shows the percentage of respondents that reported attending live music in each type of venue by state and territory. Figures for the Northern Territory should be treated cautiously as only 0.7 per cent of respondents identified as living there.
The patterns of attendance are reasonably consistent across the data, with the bulk of consumers reporting they attended live music in small venues, pubs and clubs. A very small number (Gibson & Homan, 2004).
Although there is no robust national, state, or even city-based attendance data for this third tier of venues, our consumer-centric methodology implicitly accommodates expenditure on and the subsequent economic impacts of this category of venue; even if we do not have sufficient confidence in the representativeness of the data to draw categorical conclusions about tier-level attendances.