Projects
As noted above, our survey captured highly engaged consumers whose attendance at live music events is unlikely to be representative of the broader population. Modelling the costs and benefits of live music in Australia depends, however, on an estimate of the volume of activity consumption. In other words, how much and how often do people consume live music?
In the absence of representative primary data, we have drawn on attendance and sales figures from Live Performance Australia (LPA) and the Australian Performing Rights Association (APRA AMCOS) (Ernst & Young, 2011, 2014), and cross-referenced it with data from the ABS (2010a, 2014a).
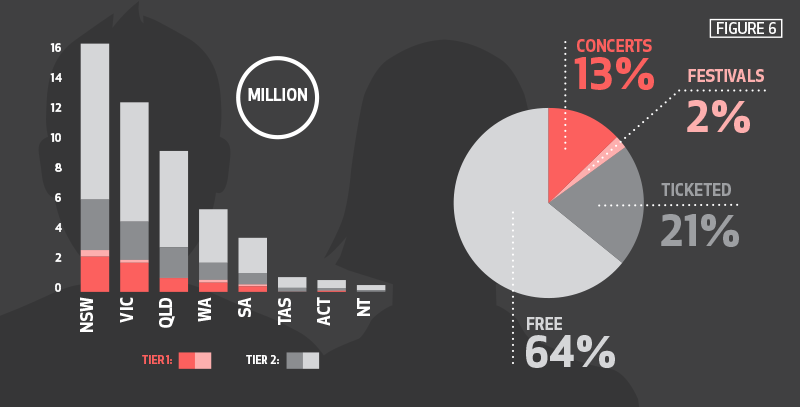
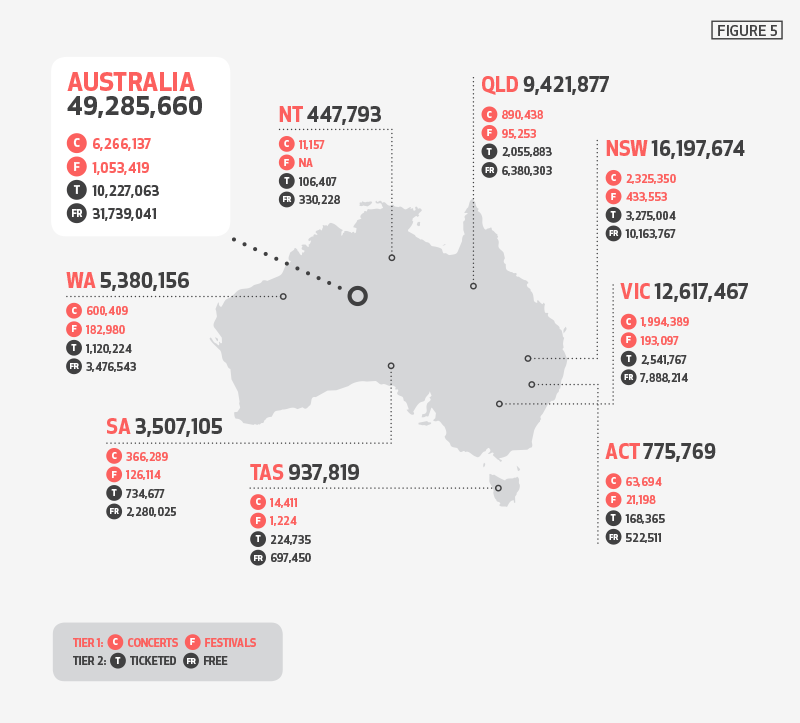
Major ticketing companies, a number of larger self-ticketing venues and promoters, together with the Australian Council for the Arts contribute ticketing data to Live Performance Australia’s (LPA) annual Ticket Attendance Survey and Review. In 2013, it was reported that there were 6.3 million tickets sold to contemporary music concerts at established venues, and another 1.1 million in tickets sales at single category (predominantly live music) festivals (Ernst & Young, 2014). These could be described as Tier 1 live music venues / events (Hearn, Ninan, Rogers, Cunningham, & Luckman, 2004).
The second Ernst & Young (2011) report on the Australasian Performing Right Association (APRA AMCOS) venue based live music industry revealed a total of 42.0 million live music attendances at, “…pubs / bars, clubs, restaurants / cafes and nightclubs,” licensed by APRA AMCOS to host live music, or Tier 2 live music venues. Of these, 10.2 million were ticketed attendances, with the balance being un-ticketed (presumably free to enter / attend).
We recognise that some tickets sales may be captured in both the LPA and APRA AMCOS reports, giving rise to the risk of double counting. This risk is slight, however, as the average Tier 1 ticket price is over 100 dollars; whereas Tier 2 tickets are variably valued by Ernst & Young (2011) at between 10 dollars and 23 dollars per unit.
Figure 5 and Figure 6 therefore give us a conservative reference point for live music attendance from the best currently available national data; although we cannot let this pass without reiterating the urgent need for a more complete and robust census of the live music sector in Australia.
Due to their own limitations of method and scope, it is not suggested that the source reports used in our estimation (either in isolation or collectively) are perfectly representative of the sum of live-music attendance in Australia. After all, neither study purports to capture attendance at informal venues such as warehouses, house parties, school concerts or pop-up performances. As previously noted, the report prepared for APRA AMCOS (Ernst & Young, 2011) was found to potentially under-represent the volume of live music activity in Melbourne (Newton, 2012).
Given the composition of our consumer sample, we have also self-imposed a conservative constraint to our inquiry, limiting it to contemporary music. Thus excluded are other ticketed and non-ticketed live music forms such as classical, opera, musical theatre, other festivals, and special events.
Therefore, despite this report assigning a much larger value to the live music industry in Australia than those that have gone before it, we nonetheless significantly under-represent the entirety of live music making in Australia. To give an indication as to the impact of this understatement, the LPA figure of 7.3 million we use excludes over four million other potentially relevant ticket sales, as well as sales that went unreported.